2026 Insurance Alternative Investment Landscape
From Opportunity Identification to Portfolio Architecture
Over the past three years, the insurance alternative investment landscape has been shaped by a series of macroeconomic shocks, balance sheet constraints, and shifting opportunity sets across private markets. Each annual installment of this series has reflected the realities insurers faced at the time—and the actions required to navigate them.
As we enter 2026, the market has turned an important corner, even as macroeconomic and market volatility persists. Commitments are increasing, capital is being deployed, and insurers are moving beyond a purely defensive posture. The focus now shifts from whether to invest in alternatives to how to design durable, capital-efficient programs that can perform across cycles.
This year’s discussion builds directly on the foundation established and reframes the conversation around program design, implementation discipline, and balance sheet alignment in an environment that remains dynamic.
A Brief Recap
In 2025, elevated public market valuations strengthened the case for rotating toward private assets. While insurers’ new commitments to alternative assets stabilized, the recovery was uneven across asset classes. Amid ongoing distribution uncertainty and persistent inflation, we emphasized cash-yielding strategies—particularly private credit and real assets—as well as secondaries. At the same time, we positioned private equity as a core long-term allocation, implemented through a mix of secondaries, co-investments, and selective primaries.
What Changed in 2025: Commitments Have Turned the Corner
Entering 2026, the data suggests a meaningful inflection point. New commitments to alternatives increased materially in 2025 relative to the prior year, with growth led by private credit and real assets, and a more modest recovery in private equity. Property & casualty and health insurers accounted for a disproportionate share of the increase, while life insurers continued to represent the majority of absolute commitments.1
This pattern is not surprising. Cash-yielding strategies help address the effects of the distribution drought, while real assets and private credit remain well positioned in an environment characterized by the current interest rate and macro environment. Importantly, insurers’ actions in 2025 are broadly consistent with the recommendations we have made over the past several years.
NEW COMMITMENTS INCREASED MATERIALLY IN 2025
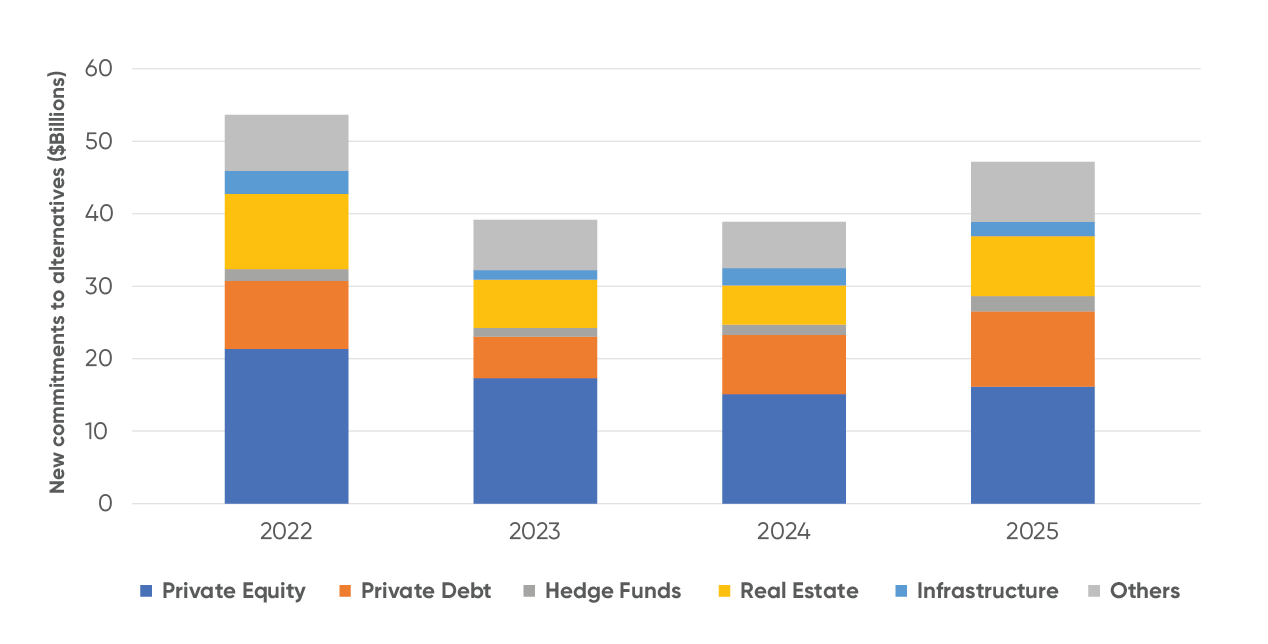
Source: S&P Capital IQ Pro, LTM ending in Q3 each year, data as of 9/30/2025
COMMITMENTS GROWTH LED BY PRIVATE CREDIT AND REAL ASSETS
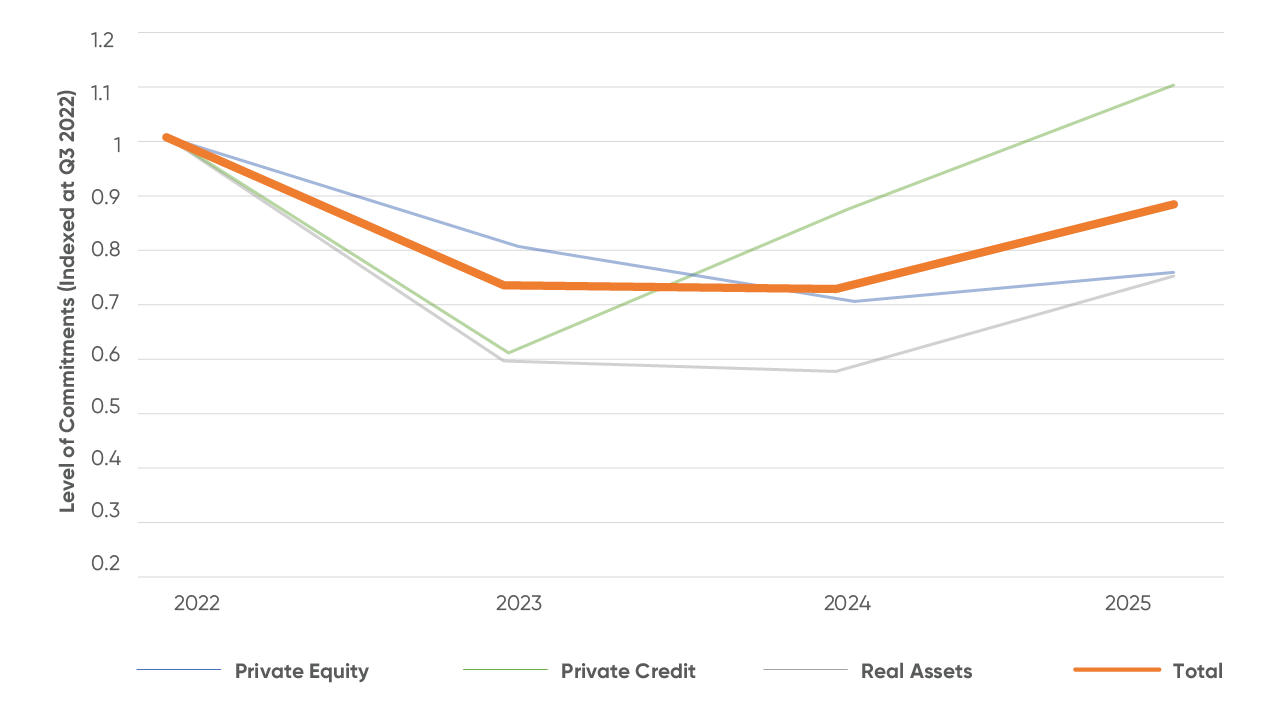
Source: S&P Capital IQ Pro, LTM ending in Q3 each year, data as of 9/30/2025
PROPERTY & CASUALTY AND HEALTH INSURERS ACCOUNTED FOR A DISPROPORTIONATE SHARE OF THE INCREASE
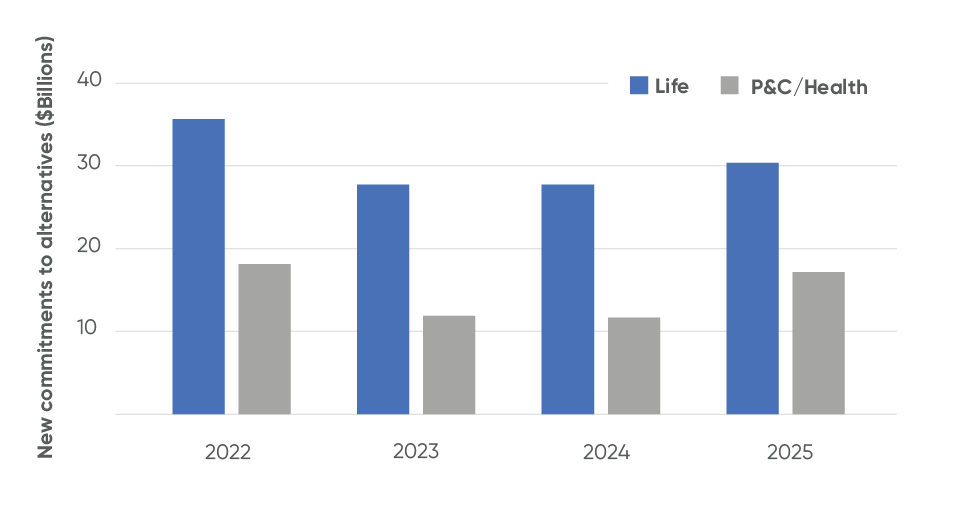
Source: S&P Capital IQ Pro, LTM ending in Q3 each year, data as of 9/30/2025
However, renewed momentum brings a new challenge. As allocations scale, implementation risk, pacing, capital treatment, and liquidity management become equally as important as asset selection.
"The next phase for insurers is not simply increasing exposure to alternatives, but architecting portfolios that are repeatable, flexible, and aligned with the unique characteristics of insurance balance sheets."
Real Assets: From Tactical Allocation to Portfolio Tool
Real assets have reasserted themselves as a core component of insurers’ alternatives portfolios, but their role is evolving. Rather than viewing infrastructure and real estate as monolithic asset classes, insurers increasingly approach them as tools designed to perform specific portfolio roles.
INFrastructure
Infrastructure has expanded well beyond its historical role as a fixed-income substitute. Core and core-plus assets continue to offer relatively stable, long-dated cash flows supported by essential services and contractual or regulated frameworks, many of which include explicit or implicit inflation mitigation. At the same time, opportunities in digital infrastructure, the energy transition, and select value-add strategies allow investors to access higher potential return profiles while maintaining diversification benefits and downside resilience.
For insurers, infrastructure can serve as both a cash-flow anchor and a long-term value creation asset, particularly when implemented through programs that balance return objectives, capital treatment, and deployment pacing.
INFLATION RESILIENCE
We have previously discussed the role of real assets in providing resilience under macroeconomic uncertainty. Infrastructure offers a useful lens through which to examine how asset-level characteristics can mitigate inflation and rate-related pressures.
Infrastructure is often described as an inflation hedge, but the mechanism is more nuanced than simple CPI indexation and differs across the capital structure. While certain assets—such as regulated utilities and availability-based public–private partnerships—feature explicit CPI-linked revenues, many infrastructure investments rely on a combination of contractual escalation and pricing flexibility. Infrastructure debt provides long-dated cash flows that may incorporate inflation linkage through contractual features but remains more bond-like in its rate sensitivity. Infrastructure equity, by contrast, benefits from additional structural characteristics—including operating leverage and the ability to reset or renegotiate prices over time – which can enhance inflation pass-through.
These characteristics help explain why infrastructure – particularly on the equity side – has historically exhibited limited sensitivity to inflation-driven rate increases despite its long-dated cash-flow profile. Rather than behaving like a fixed-coupon bond, infrastructure frequently functions more like a regulated or contracted operating business whose cash flows and asset values can adjust over time.
Empirical observations from private infrastructure equity programs further support this dynamic, particularly when vintage years coincide with inflationary environments. Analysis of fund performance relative to changes in interest rates can reveal effective durations that are modestly low to near-zero — suggesting that inflation passthrough mechanisms and contractual protections largely offset discount-rate / valuation pressure. This relationship can persist even when accounting for the lagged transmission of rate changes into valuations.
Infrastructure and Asset–Liability Management (ALM)
Infrastructure also plays a distinct role from an asset–liability management perspective.
Infrastructure debt represents the most direct ALM tool, offering bond-like cash flows with extended maturities and enhanced spreads. Infrastructure equity, by contrast, should be viewed as a long-lived, cash-flowing asset that reduces reinvestment risk and provides inflation alignment, rather than as a duration instrument: while infrastructure assets generate long-dated cash flows, their valuation does not generally exhibit the same interest-rate sensitivity as long-duration fixed income instruments.
The ALM relevance of infrastructure equity lies in the timing, visibility, and persistence of cash flows rather than mark-to-market duration. Infrastructure assets typically generate stable, long-dated cash flows under contractual or regulated frameworks. While not fixed, these cash flows are typically highly visible and frequently incorporate inflation linkage through escalation mechanisms broadly mirroring many long-term insurance liabilities, which are primarily nominal but exposed to gradual inflation pressure.
Together, infrastructure debt and equity can support portfolio-level cash-flow matching while reducing reliance on shorter-duration assets that must be reinvested frequently in uncertain rate environments.
Real Estate
The real estate market has entered a new phase following the most rapid and aggressive rate hiking cycle in more than three decades. Asset prices have adjusted meaningfully—declining approximately 16% from peak levels2—yet underlying fundamentals have proven far more resilient. Net operating income has continued to grow at an annualized rate of more than 2% since 2022, highlighting a clear disconnect between pricing and income.3 This divergence reflects a market driven more by capital markets dislocation than by asset level deterioration, creating a constructive setup for forward-looking investors.
Importantly, this repricing is not merely cyclical noise. Higher financing costs mathematically require lower entry bases to achieve comparable returns, and that adjustment is now taking hold across many segments of the market. Depressed transaction volumes reflect delayed price discovery, not stable valuations. As upcoming debt maturities force resolution, we expect a multi-year period of increased transaction activity at potentially attractive entry prices.
Where We See Value in Real Estate: The Middle Market & Niche Property Types
NUMBER OF TRANSACTIONS
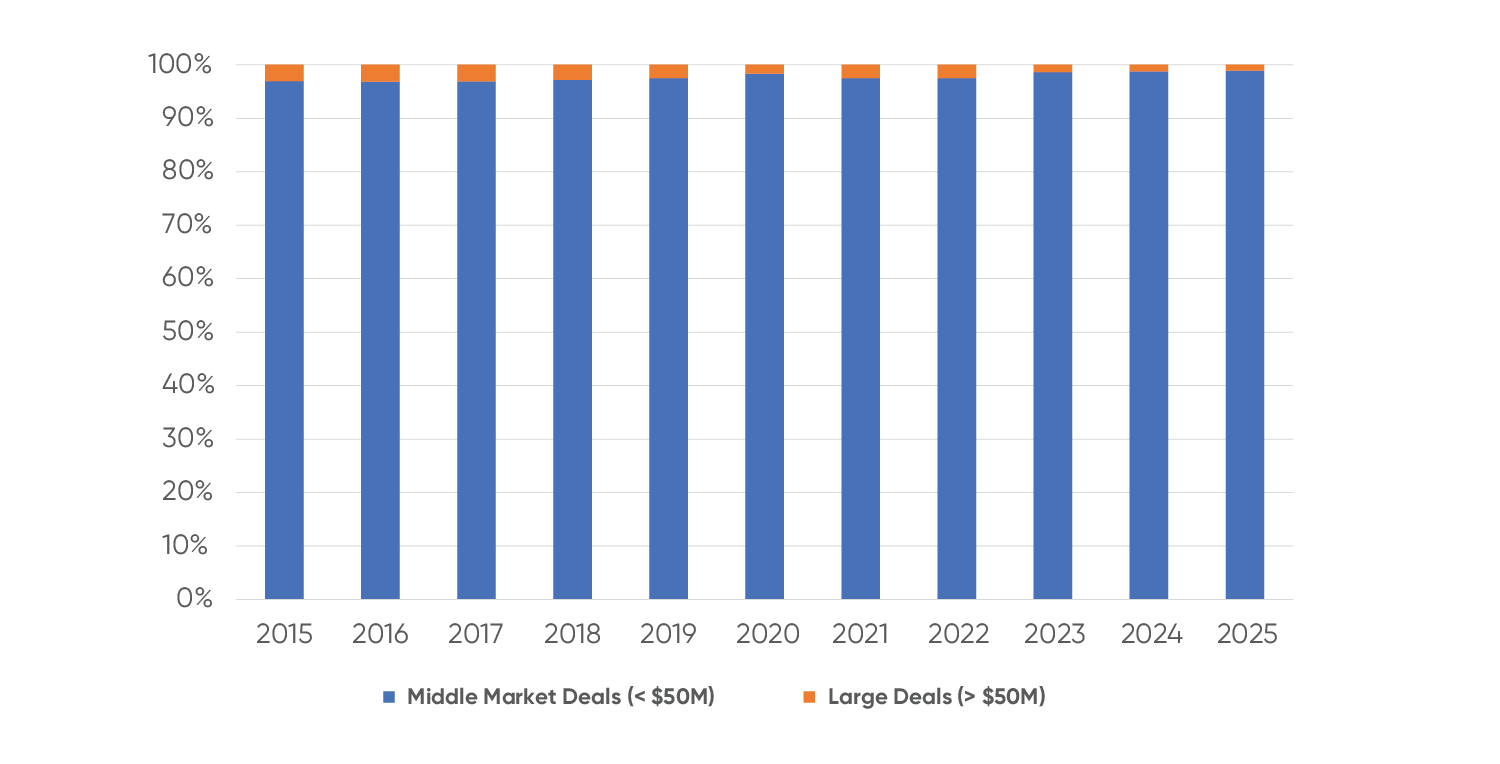
Source: CoStar. data as of December 31, 2025.
CAP RATES
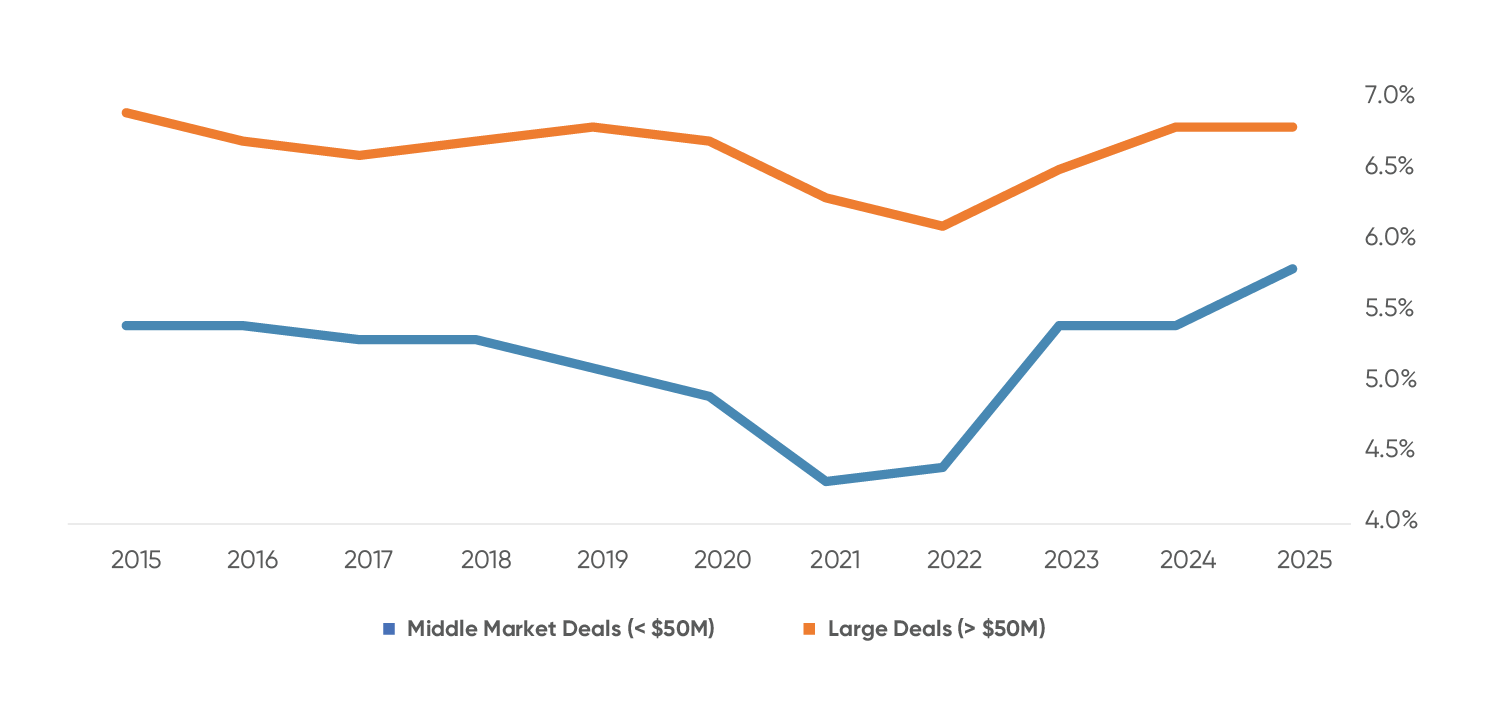
Source: CoStar. Data as of December 31, 2025
100 bps+
yield differential
Public real estate markets have already migrated meaningfully toward these niches, with such sectors now representing a substantial share of REIT exposure. Private markets, by contrast, are still earlier in this transition, creating an opportunity to capture both pricing inefficiencies and secular growth trends.
Beyond Beta: Platform Strategies as a Source of Alpha
While the pricing reset and middle market exposure provide an attractive foundation for real estate returns, we believe the opportunity set today extends beyond traditional asset-level beta. A key differentiator is the ability to generate incremental alpha through platform-oriented strategies.
Rather than investing solely at the asset level, platform strategies involve partnering with high-quality real estate operators and participating in their growth across multiple dimensions. This can include seeding capital for new strategies, co-GP investments, and direct or synthetic ownership at the operating company level. By engaging with platforms earlier in their lifecycle, investors can often secure enhanced economic and governance rights—such as shares of fee or promote revenue, preferential access to future deal flow, and board directorships—that are difficult to replicate in conventional commingled funds.
These structural sources of return can be materially additive to asset-level performance and can compound over time as platforms scale and raise additional third-party capital. As a result, platform strategies offer a way to enhance total returns while maintaining diversification across property types, geographies, and the capital stack.
Taken together, the current real estate environment combines three powerful elements: a meaningful pricing reset, persistent income growth, and the ability to layer structural alpha on top of asset-level exposure. In our view, this combination makes real estate—particularly in the middle market and through platform-oriented approaches—a compelling component of the alternative investment opportunity set going forward.
Customized Solutions: From Allocation to Portfolio Architecture
As alternatives grow in scale and complexity, standardized commingled products increasingly fall short of meeting insurers’ needs. Insurance liabilities are heterogeneous by design, with varying durations, optionality, and sensitivity to macroeconomic conditions. Regulatory capital and accounting treatment further complicate portfolio construction.
Customized solutions address these challenges by allowing portfolios to be built around specific objectives rather than generic fund parameters. Tailored programs can control deployment pacing, align asset duration with liability profiles, improve capital efficiency through thoughtful structuring, and reduce fee layers. Importantly, customization also enables portfolios to adapt as market conditions and regulatory frameworks evolve, rather than remain static.
Effective customization requires breadth across asset classes, differentiated access beyond plain-vanilla beta, and deep execution capabilities spanning underwriting, structuring, operations, and ongoing portfolio management. When implemented well, customized solutions complement insurers’ internal teams and enable more deliberate portfolio architecture across private credit, real assets, and private equity.
Regulatory Considerations: Navigating an Evolving Capital Framework
Portfolio design does not occur in a vacuum. As insurers refine their alternatives programs, the regulatory capital framework governing those allocations continues to evolve — and in ways that could meaningfully influence asset class attractiveness and portfolio construction decisions.
CLO
Two parallel NAIC initiatives are currently addressing RBC treatment for CLOs.
The Valuation of Securities (E) Task Force (VOSTF) has proposed requiring CLOs to be financially modeled by the NAIC Structured Securities Group (SSG), while the Risk-Based Capital Investment Risk and Evaluation (E) Working Group (RBC IRE WG) is developing a principles-based RBC framework for ABS, beginning with broadly syndicated loan (BSL) CLOs.
Updated RBC factors are expected to be previewed around April 2026, with potential adoption by mid-2026 for year-end 2026 effectiveness. Based on preliminary review of the Academy’s analysis, higher-quality CLO tranches may see reduced capital charges under the proposed framework, while below-investment-grade tranches could experience materially higher capital requirements.
LIFE RBC AGGREGATION
Another potentially high-impact yet relatively under-the-radar item is Proposal 2025-13-L from the Life Risk-Based Capital (E) Working Group, which focuses on the covariance component of the life RBC formula — the mechanism that implicitly recognizes diversification across risk categories.
Under the current framework, insurers benefit from diversification credits that reduce aggregate required capital relative to the simple sum of standalone risk charges; the proposal would modify how these interaction effects are calculated and distributed across the C-1, C-2, C-3 and related risk components. Although the proposal has been discussed, it has not yet been formally exposed or adopted, and further advancement has been paused pending additional impact analysis and alignment with ongoing C-3 and GOES (Generator of Economic Scenarios) updates.
In its current conceptual form, the proposal could reduce or reallocate existing diversification benefits within the covariance calculation, potentially increasing total required capital for insurers with material market-sensitive or spread-sensitive exposures, particularly those with significant allocations to structured credit or alternative assets.
From Inflection to Intention
The past several years required insurers to navigate volatility, capital constraints, and shifting market signals. What distinguishes the current moment is not simply improving sentiment or higher commitment volumes, but greater clarity. We believe entry points are more rational, income is more durable, and the structural characteristics of private assets are better understood within the context of insurance balance sheets.
The opportunity now is less about adding exposure and more about refining execution—calibrating risk, pacing capital thoughtfully, and ensuring that return objectives are aligned with liability structures and regulatory realities. In an environment where both markets and capital frameworks continue to evolve, discipline and intentional design matter more than scale alone.
We believe insurers that approach alternatives with this level of precision—integrating underwriting, structuring, and governance into a coherent long-term framework—will be positioned not just to participate in the next cycle, but to shape outcomes across cycles.
“The opportunity now is less about adding exposure and more about refining execution—calibrating risk, pacing capital thoughtfully, and ensuring that return objectives are aligned with liability structures and regulatory realities.”