Secondaries: An Oasis in a Desert of Illiquidity
Past performance is not necessarily indicative of future results. No assurance can be given that any investment will achieve its given objectives or avoid losses. Unless apparent from context, all statements herein represent GCM Grosvenor’s opinion.
Select risks include: market risk, macroeconomic risk, liquidity risk, interest rate risk, and operational risk.
Introduction

Past performance is not necessarily indicative of future results. No assurance can be given that any investment will achieve its given objectives or avoid losses. Unless apparent from context, all statements herein represent GCM Grosvenor’s opinion. Select risks include: market risk, macroeconomic risk, manager risk, liquidity risk, interest rate risk, and operational risk.
DECLINING NET CASH FLOWS ARE INCREASING LIQUIDITY NEEDS, WITH THE NET DISTRIBUTION RATIO IN 2023 THE LOWEST SINCE THE GLOBAL FINANCIAL CRISIS (2008 – 2009)
Global Private Capital: Annual Amount Called Up, Distributed and Net Cash Flow
2004 to 2023 (in billions of dollars)
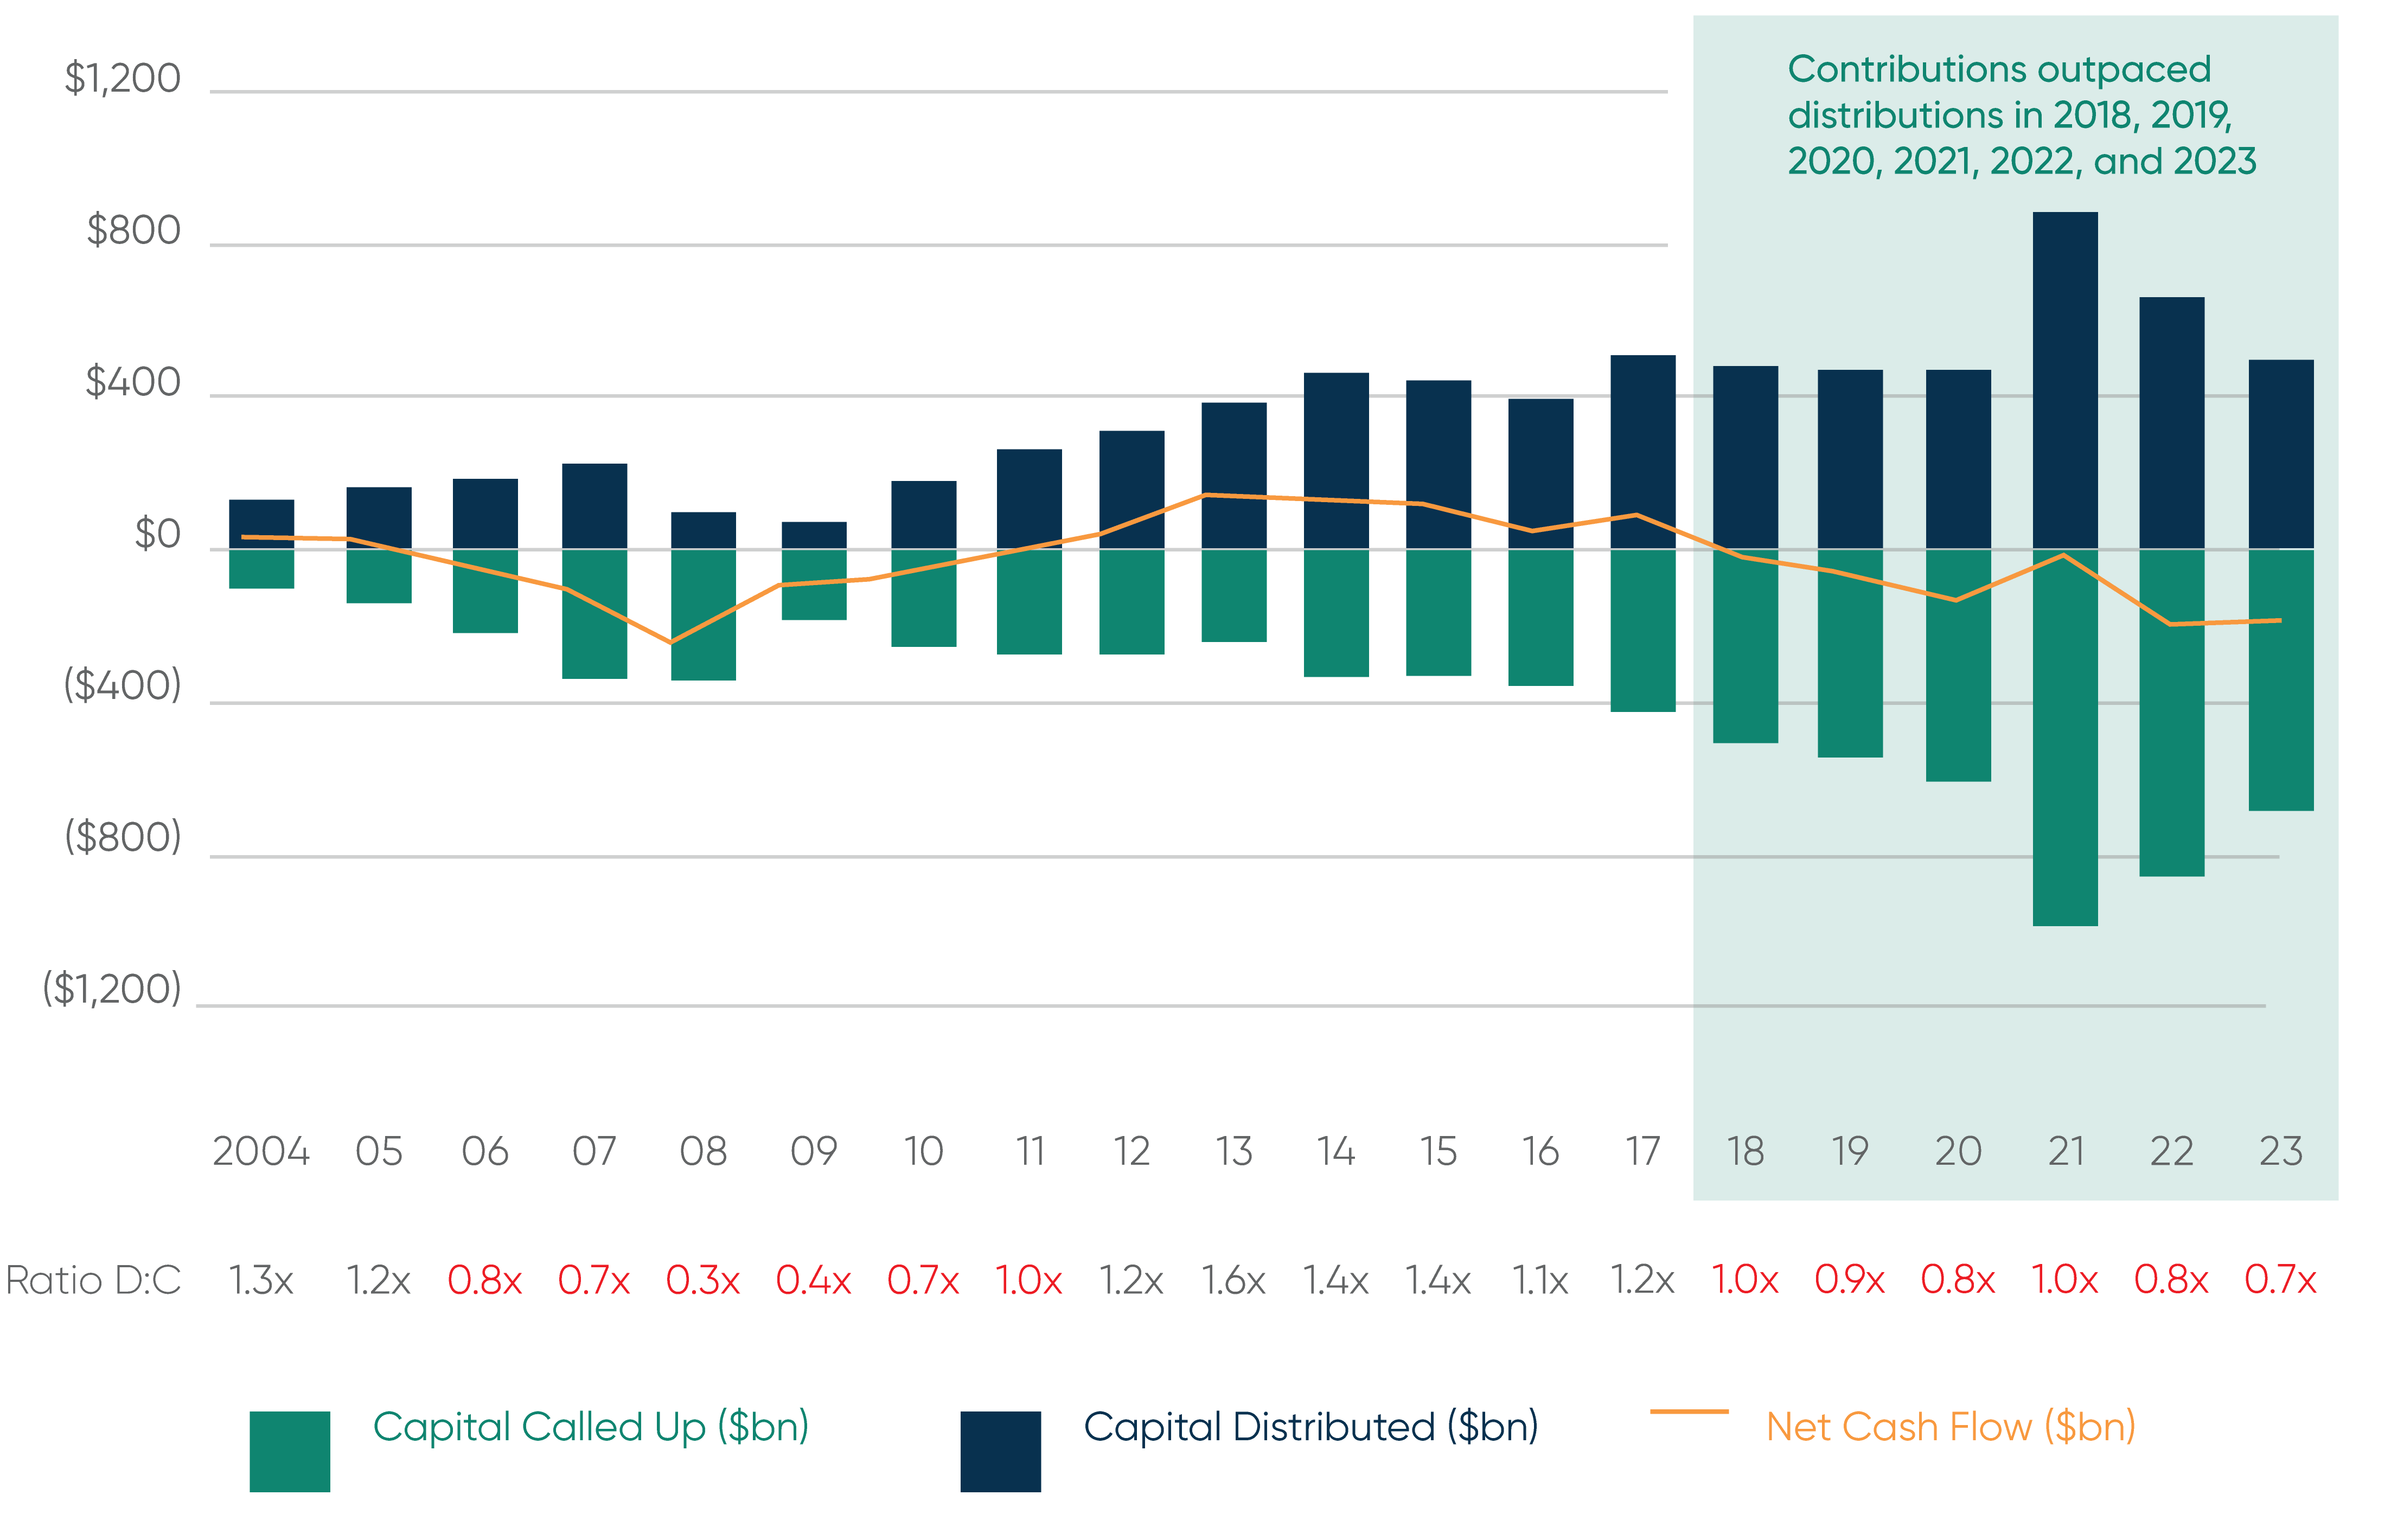
Exhibit 1
DATA SOURCE: BURGISS. Global Private Capital fund data based on published benchmark data through 12/31/2023. Data downloaded on 05/09/2024. All data is net to limited partners. No assurance can be given that any future investment will achieve its given objectives or avoid losses. Unless apparent from context, all statements herein represent GCM Grosvenor’s opinion.
When LPs turn to the secondary market, they are increasingly utilizing GP-led deals as a source of liquidity in addition to traditional LP sales. LPs are increasingly electing to sell into continuation fund opportunities (from 64% sell rate in 2021 to 85% in 2023) and as a result, secondaries comprise a growing percentage of LP distributions from GPs3. Overall, secondaries as a percentage of total private equity distributions have increased 300% over the last ten years, representing around 20% of overall PE distributions in 20234.
Putting aside the current environment, however, there are longer-term tailwinds for the secondary market that we believe will drive market growth beyond the current depressed liquidity environment. One such driver is the growth of unrealized value in private markets. As shown in Exhibit 2, unrealized value has seen consistent long-term growth – including an 18% CAGR in unrealized value from 2017 – 2022 – driven by increased fundraising and longer holding periods for investments. The average holding period for an investment has gradually increased over the last decade and now exceeds six years, up from four years before the Global Financial Crisis5. We anticipate that the continued growth in unrealized value will continue to create an ever-increasing opportunity set for the secondary market.
INCREASING SECONDARY VOLUME IS SUPPORTED BY PERSISTENT GROWTH IN UNREALIZED VALUE AND A HIGHER TURNOVER RATE OF PRIMARY COMMITMENTS
Global Buyout Unrealized Value1
US $ In Trillions
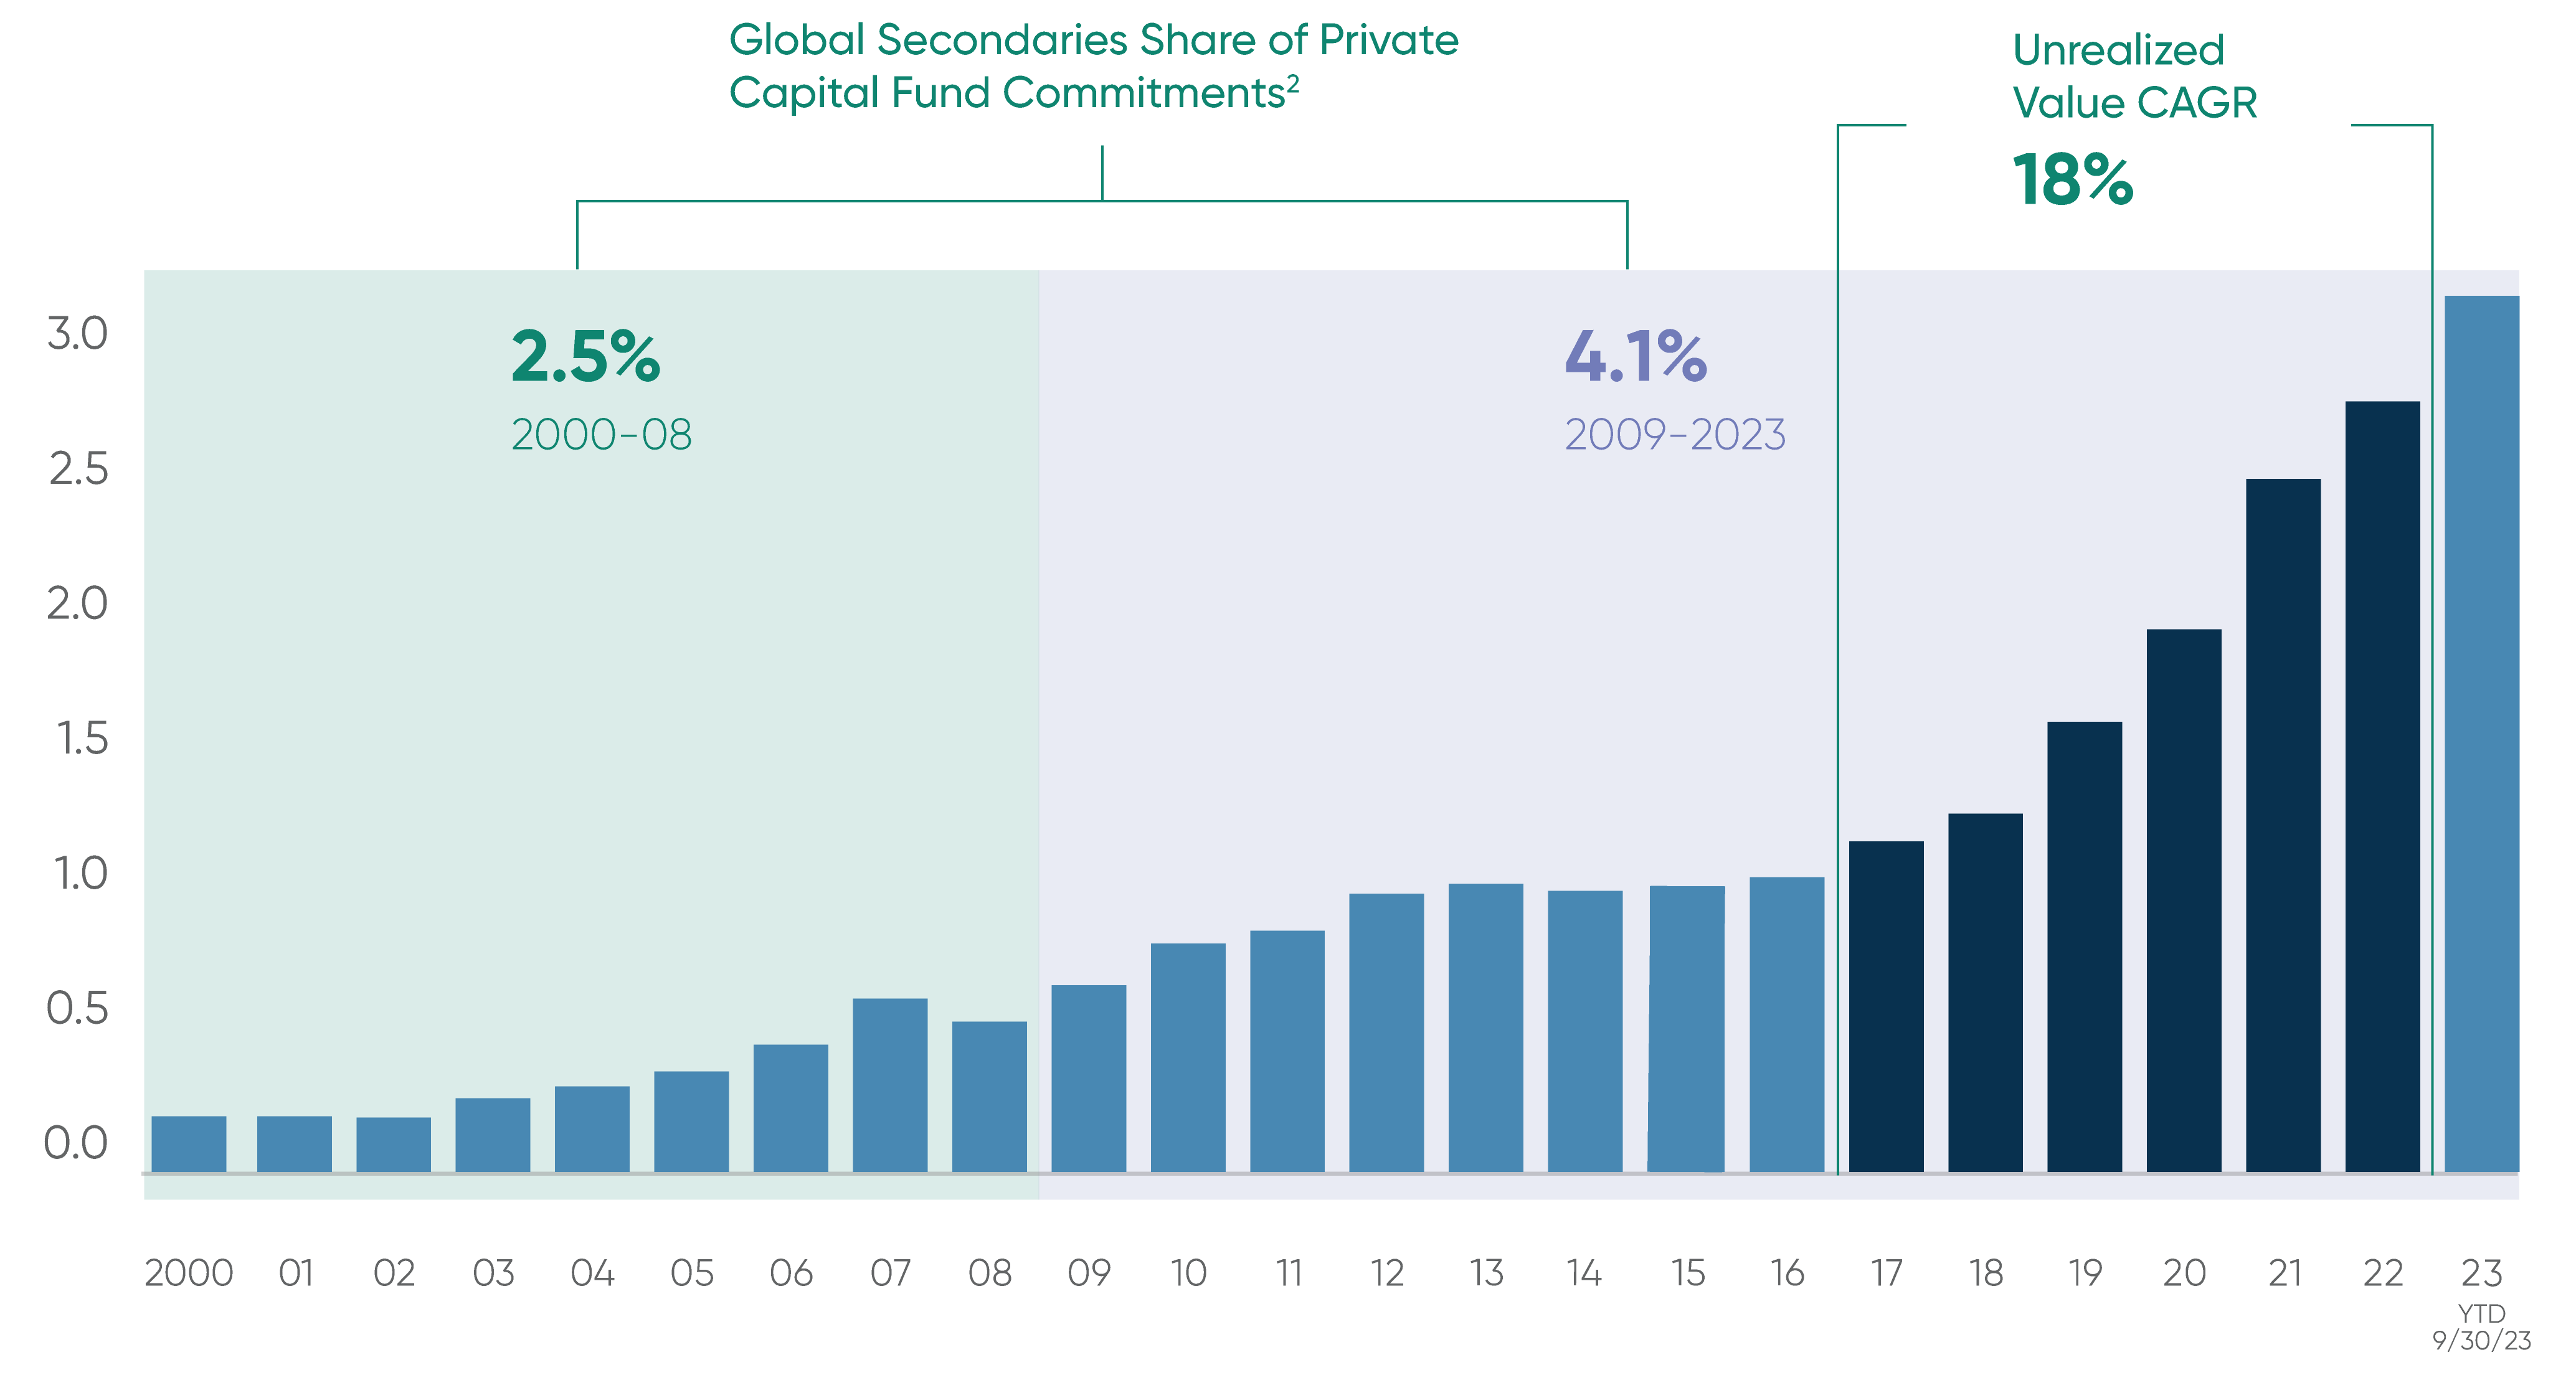
Exhibit 2
1 DATA SOURCE: PREQIN. For the Unrealized Value statistics, Buyout includes buyout, balanced, co-investment and co-investment multi-managers. Data accessed on 05/09/2024.
2 DATA SOURCE: PREQIN. All data accessed on Preqin for all Private Fund asset types (Equity, Debt, Real Estate, Infrastructure) as of 12/31/2023. Data accessed on 05/09/2024. “Secondaries” includes secondary and direct secondary strategies within Private Equity, Real Estate, and Infrastructure.
Another measure of the evolution of the secondary market is its size compared to the primary market. One way to measure this is to look at the total amount of capital raised for secondaries relative to primaries. Secondaries as a percentage of total private capital fund commitments have seen a significant long-term positive trend since the Global Financial Crisis, growing from 2.5% of private fund commitments in the years leading up to 2008 to 4.1% in the years after, a 60% increase.
SECONDARY MARKET TRENDS
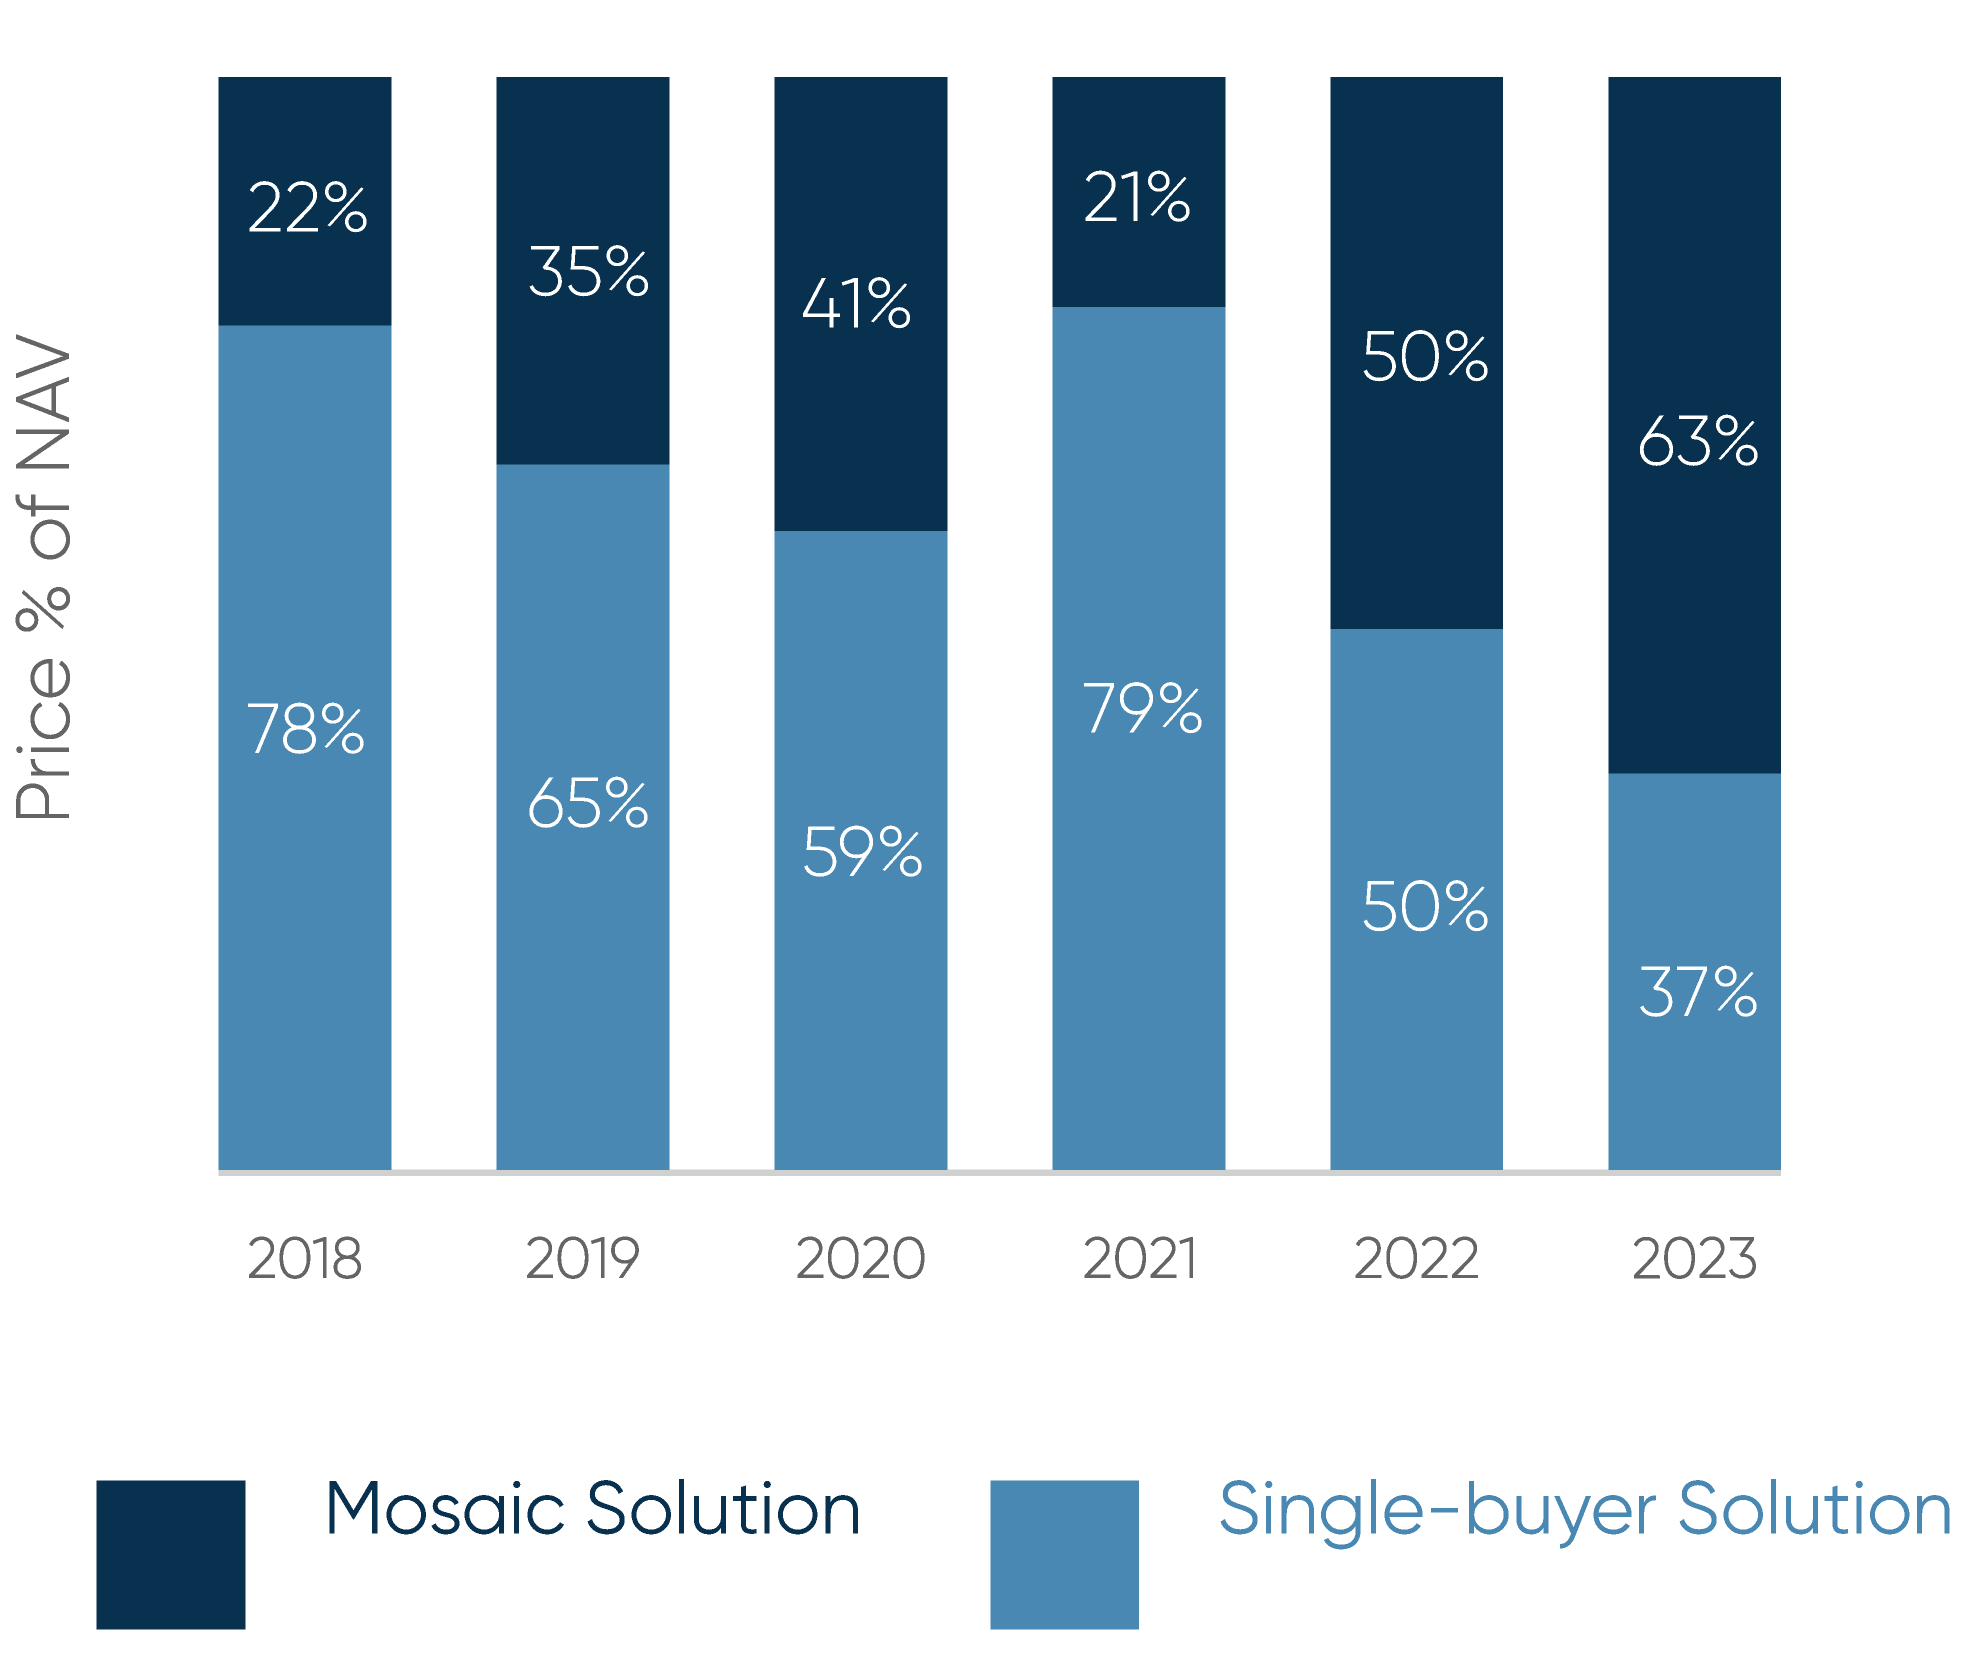
A number of recent trends in the secondary market align well, we believe, with our secondaries strategy. For LP deals, mosaic sales – portfolios being broken up among multiple buyers – continue to increase, with 63% of transactions in 2023 featuring multiple buyers (Exhibit 3). This dynamic is likely driven by secondary buyers focusing their bidding only on assets / funds with which they know well in order to mitigate the risks associated with an otherwise uncertain economic environment. Additionally, higher interest rates limit the ability of large buyers to increase their bids by applying leverage to the transactions. This combination of factors often means the best solution for a seller is an optimized mix of multiple buyers rather than a single portfolio buyer. This trend fits well with our strategy of focusing on funds where we have an information or relationship advantage, including cherry-picking select interests from large, diversified portfolios being offered for sale.
One trend that has continued to persist in the secondary market is smaller deals trading at lower prices than larger deals. As shown in Exhibit 3, over the last five years, deals under $50 million have priced over 600 basis points lower than deals over $100 million. Our focus on smaller deals, often involving middle-market funds, enables us to be selective and take advantage of discounted pricing on the lower end of the market. Equally as important, these smaller deals can have a potentially material impact on our client’s secondary portfolios given the modest size of our secondary activities relative to competitors.
SMALLER TRANSACTIONS HAVE HISTORICALLY PRICED LOWER THAN LARGER ONES, AND MEGA SECONDARY FUND CLOSINGS HAVE HEIGHTENED COMPETITION FOR LARGER DEALS, DRIVING EVEN MORE AGGRESSIVE PRICING
Mosaic Solutions Continue to Increase1
LP Portfolio Pricing by Deal Size – Last 5 Years2
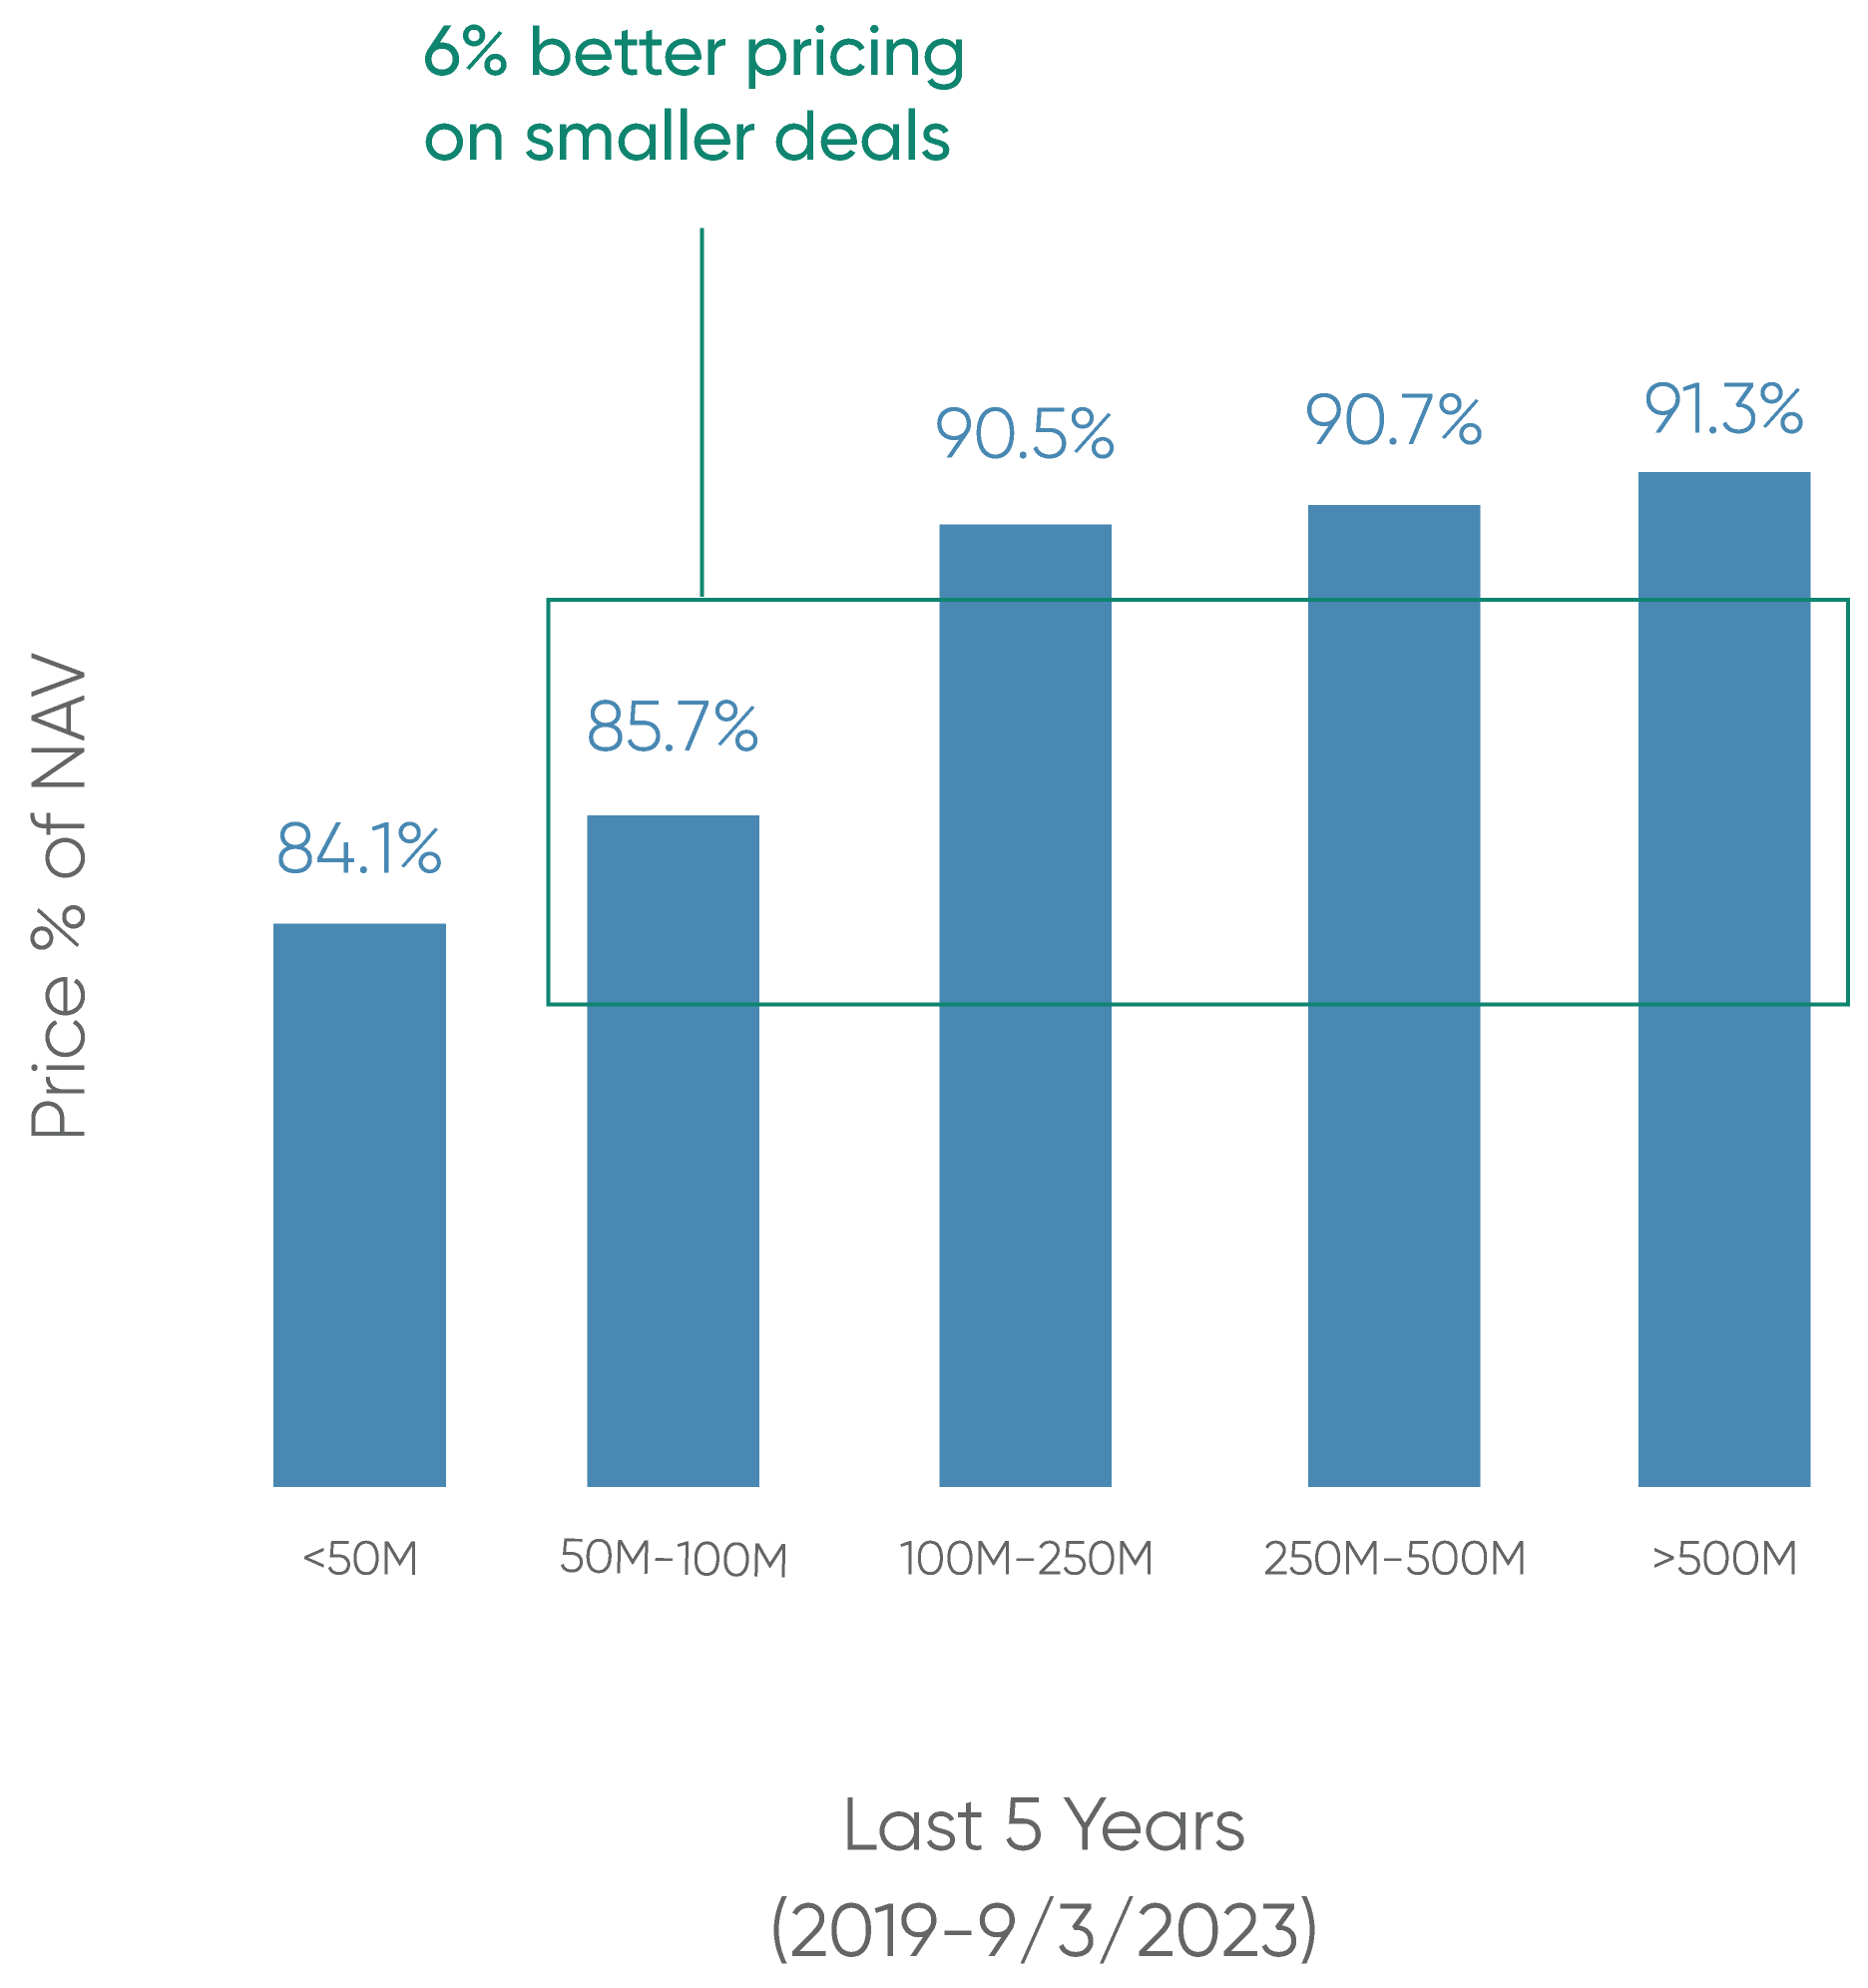
Exhibit 3
1 DATA SOURCE: GREENHILL FULL YEAR 2023 SECONDARY MARKET SURVEY RESLTS; Based on Greenhill transactions.
2 DATA SOURCE: JEFFRIES INTERNAL DATA
No assurance can be given that any investment will achieve its objectives or avoid losses. Unless apparent from context, all statements represent GCM Grosvenor’s opinion.
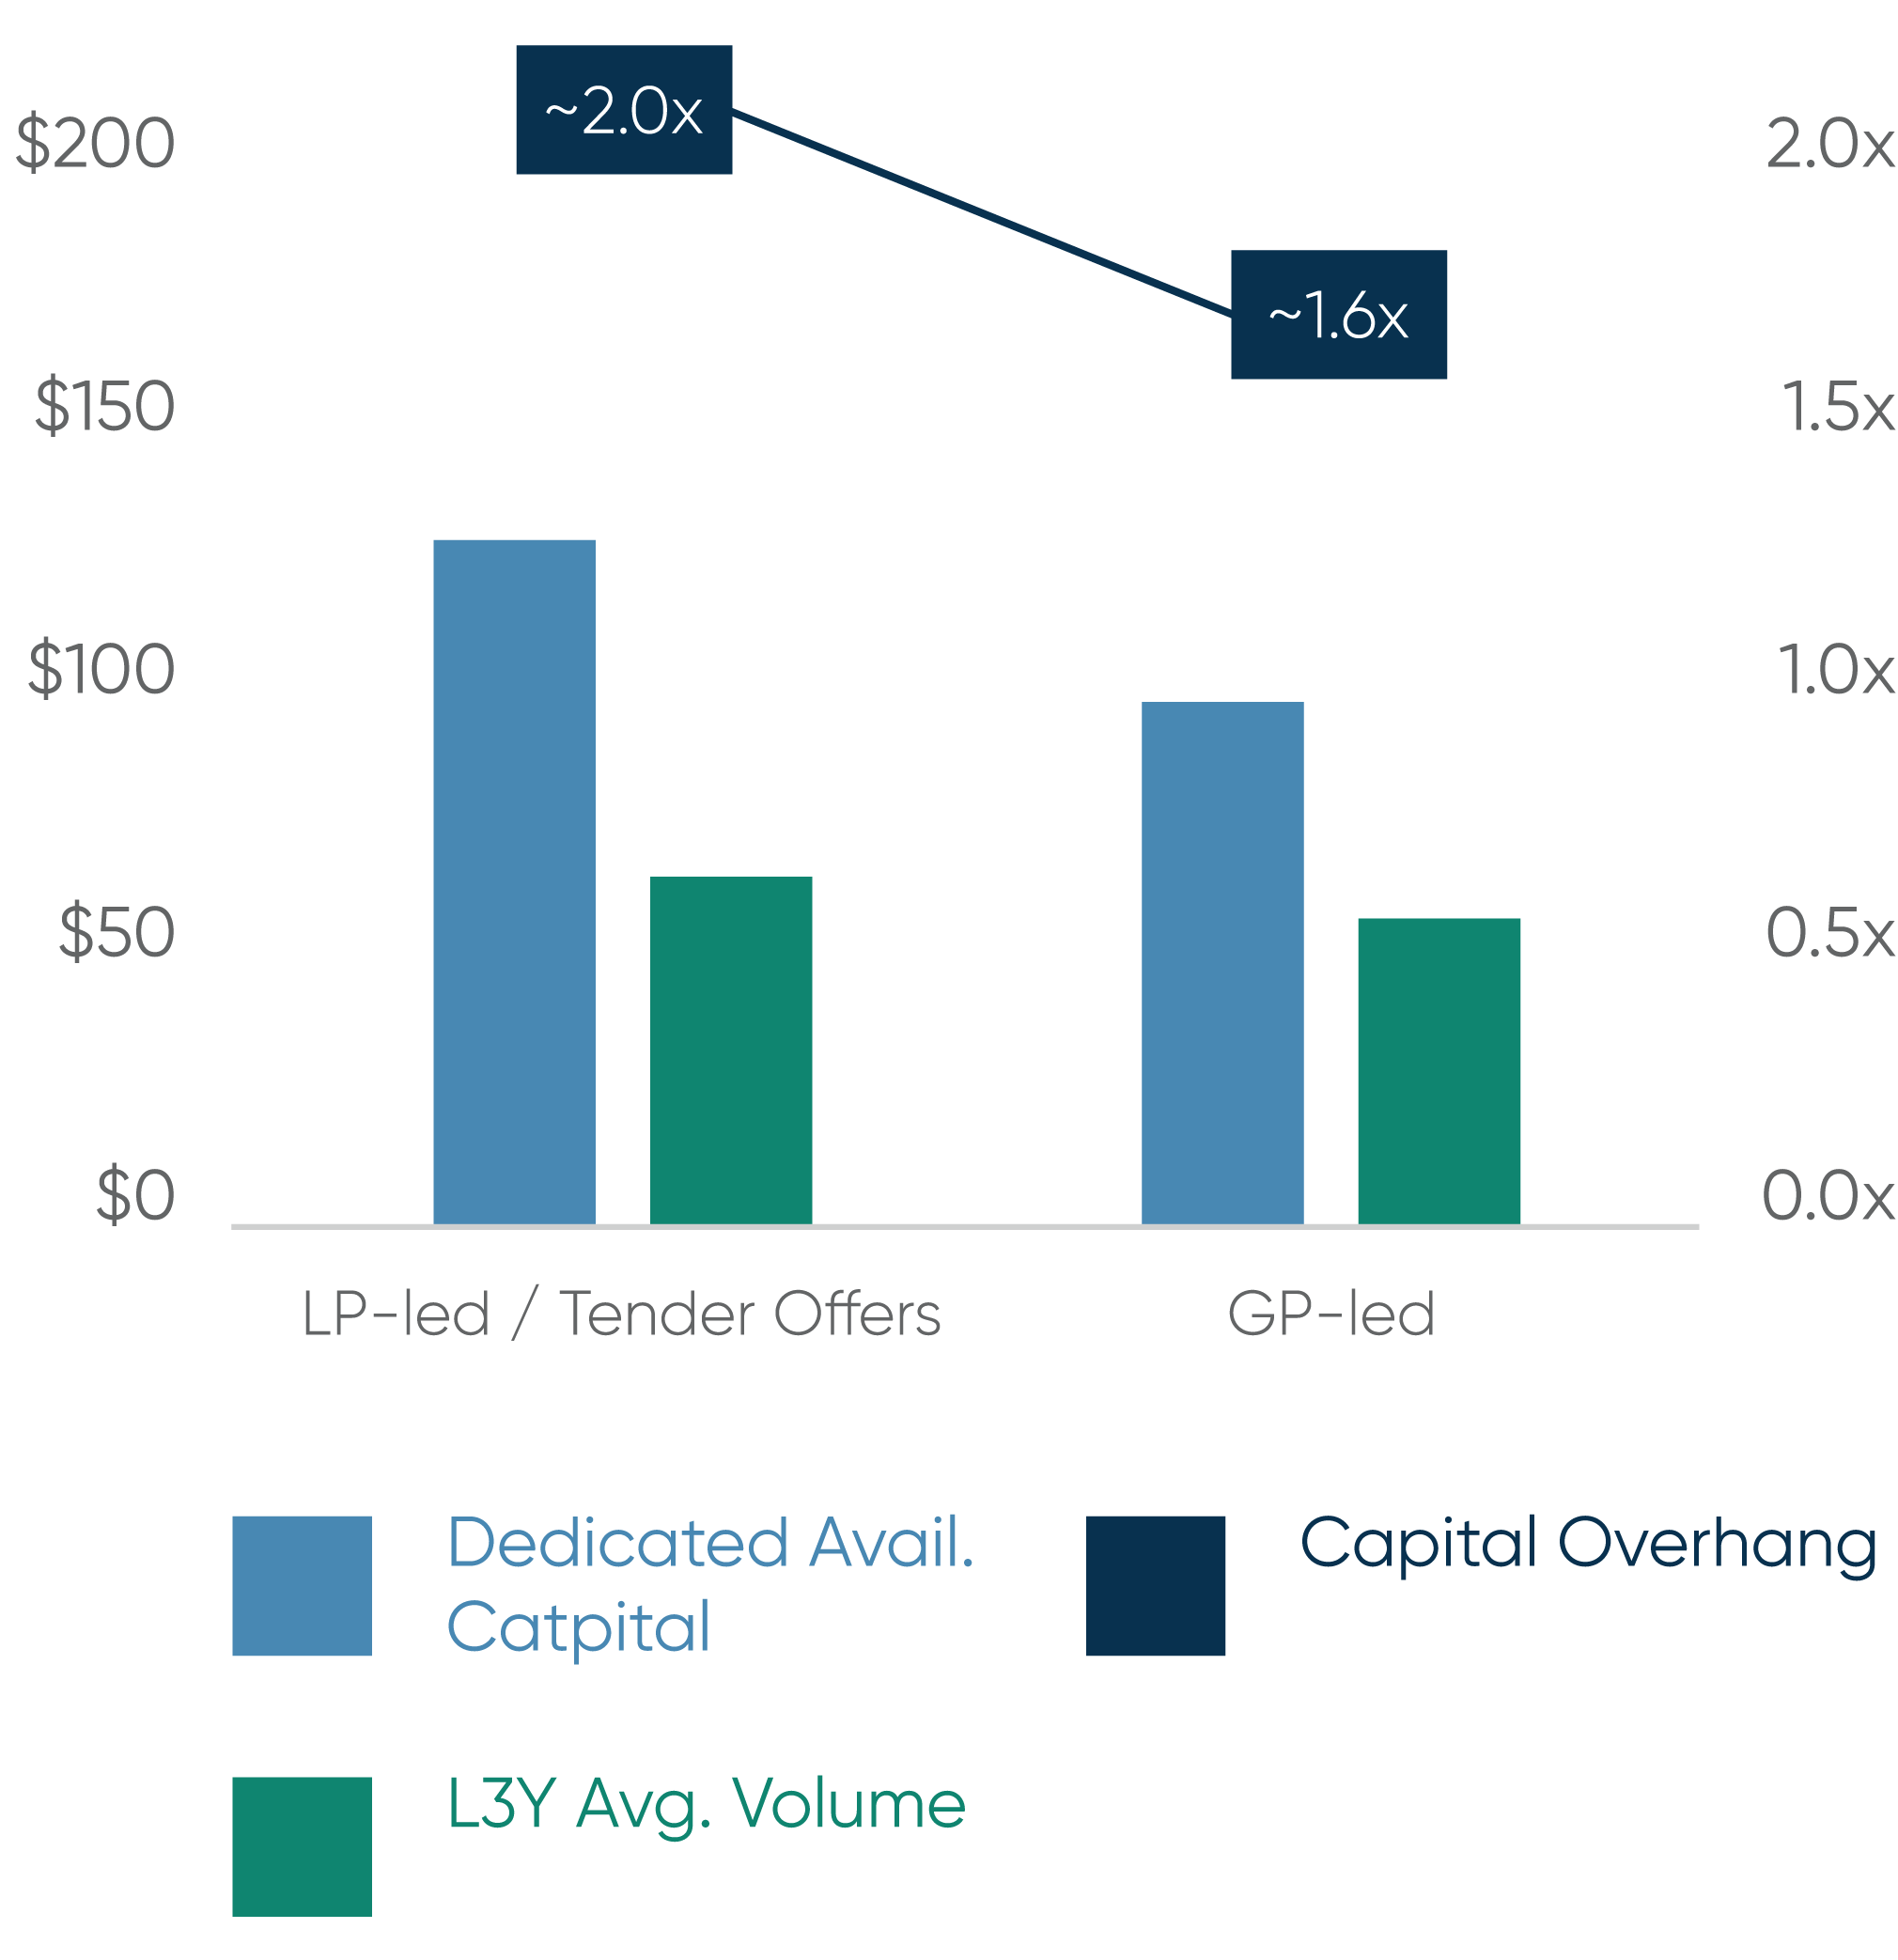
On the GP-led side of the market, the dynamics remain buyer friendly as LPs increasingly elect to sell when offered liquidity. The GP-led market is significantly undercapitalized, with an estimated capital overhang (as a ratio of dry powder to average annual deal volume) of only 1.6x for GP-led deals, compared to 2.0x for LP-led deals (Exhibit 4). One reason for the low capital overhang for GP-led deals is that many of the largest secondary buyers have restrictions on the amount of capital they can invest in GP-led deals, particularly single asset continuation funds. Because of this, it remains difficult for sponsors and their bankers to raise sufficient capital to close large (over $1 billion) continuation funds, even with a syndicate of investors. As a result, most GP-led deals involve continuation funds ranging from $200 million to $750 million. Because these deals require fewer syndicate members, the best deals can become oversubscribed quickly. Allocations to GP-led deals are controlled by the sponsor not the lead buyers, and sponsors are likely to favor existing or prospective primary investors with whom they have or can build a relationship.
GP-LED DEALS REMAIN UNDERCAPITALIZED YET SECURING AN ALLOCATION TO TOP DEALS IN THE $200 MILLION TO $750 MILLION RANGE IS HIGHLY COMPETITIVE AS THEY REQUIRE THE FEWEST SYNDICATE MEMBERS
2023 Capital Overhang ($B) (Estimated)1
Example Syndicate Composition of Closed GCM Deals2
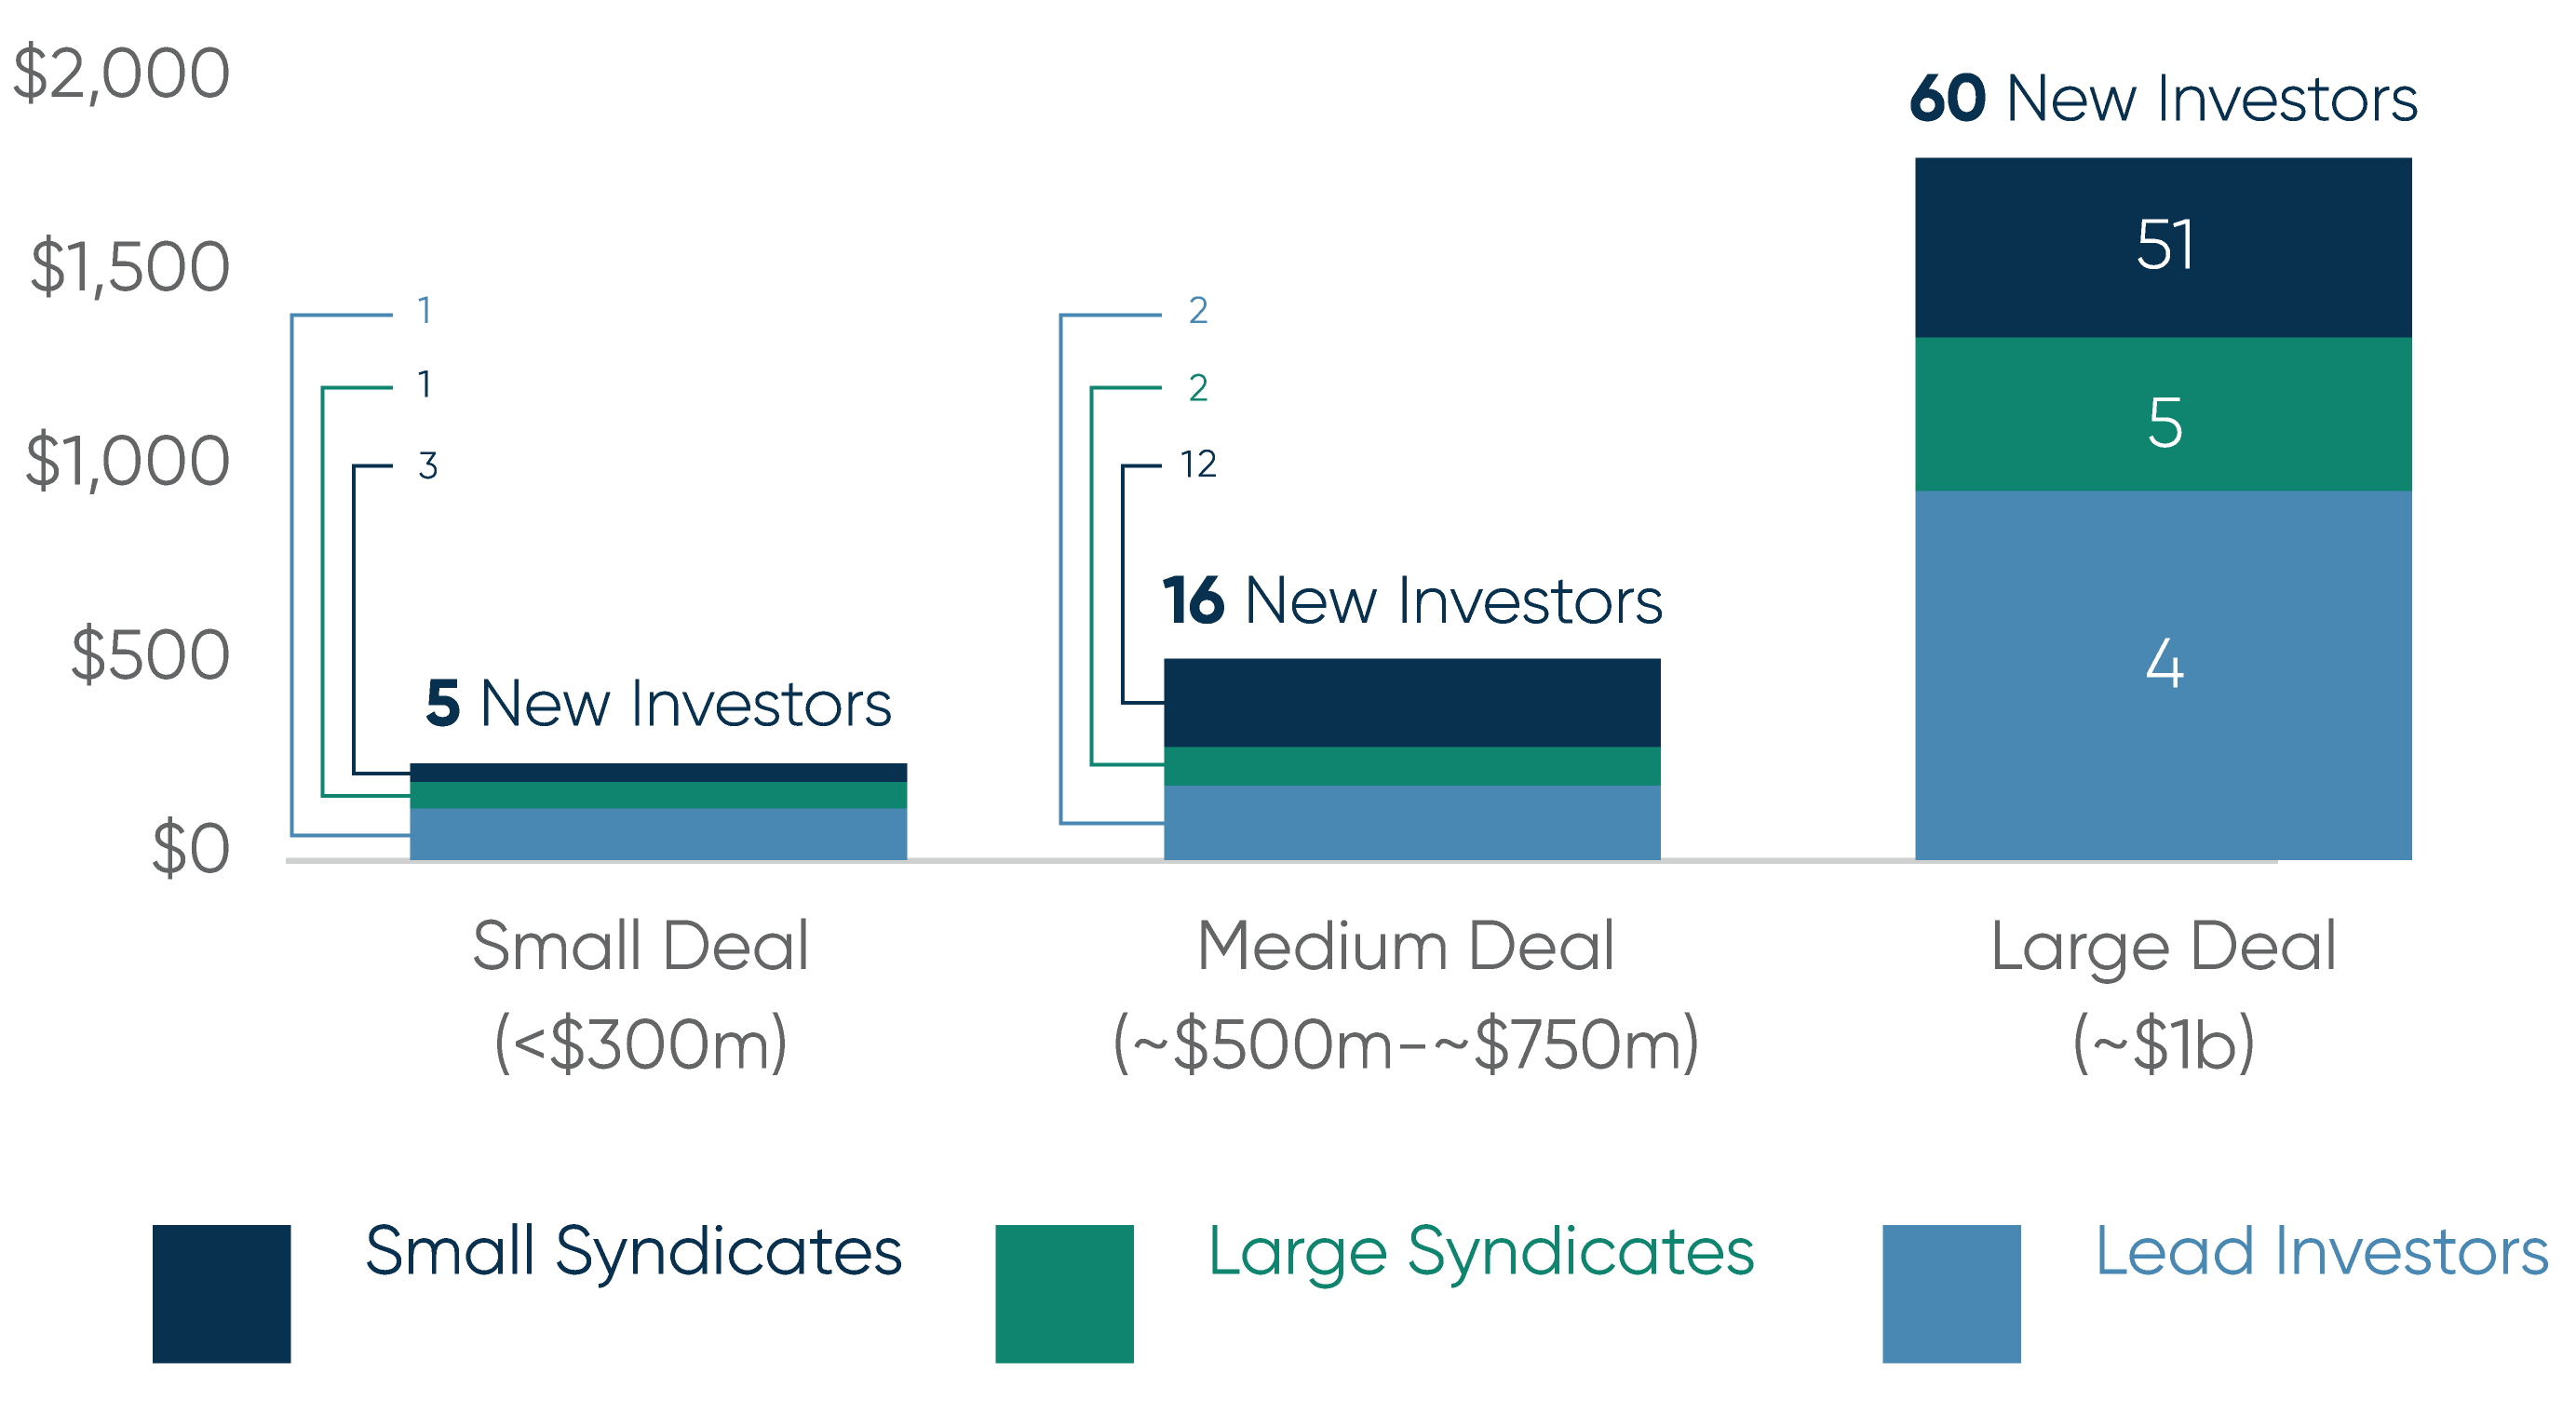
Exhibit 4
1 DATA SOURCE: EVERCORE FY 2023 SECONDARY MARKET SURVEY RESULTS; Dedicated Available Capital estimated as Available Fund
Dry Powder + Near Term Fundraising + Available Co-Invest Dry Power + Available Leverage / Recycling / Seller Financing.
2 BASED ON GCM GROSVENOR ESTIMATES. Further details available upon request.
No assurance can be given that any investment will achieve its objectives or avoid losses. Unless apparent from context, all statements herein represent GCM Grosvenor’s opinion.
In most deals that come to market, GCM Grosvenor has an existing relationship with the underlying sponsors, and our reputation as a reliable, strategic partner is increasingly an integral part of securing an allocation to oversubscribed deals.
Looking ahead
Elevated interest rates, uncertain credit markets, fears of recession, and large bid-ask spreads on asset values have all had negative effects on the M&A and IPO markets, driving the increased need for secondaries as a means for LP liquidity. While we believe this backdrop is likely to continue in the immediate term, eventually the M&A and IPO markets will open up. However, we believe the secondary market will continue to grow on the heels of multiple long-term tailwinds, including consistent growth in unrealized private equity valuations and the increasing role of secondaries in the private equity landscape. We believe GCM Grosvenor’s unique primary footprint with significant exposure to the small and mid-market buyout space – and our focus on smaller secondary transactions – gives us differentiated positioning and will allow us to seek to capitalize on the future growth of the market.
Related news and insights

Secondaries: An Oasis in a Desert of Illiquidity
We delve into the economic factors driving the staggering growth of the secondary market.

What Makes GP-Led Secondary Transactions a Compelling Opportunity?
We discuss how GP-led secondaries differ from traditional LP-led deals, and why we believe they present a compelling opportunity in the infrastructure space.
1 DATA SOURCE: EVERCORE FY 2023 SECONDARY MARKET SURVEY RESULTS
2 DATA SOURCE: PITCHBOOK | LCD Data Through September 30, 2023
3 DATA SOURCE: EVERCORE FY 2023 SECONDARY MARKET SURVEY RESULTS
4 DATA SOURCE: BURGISS. Universe of primary private equity funds. Data pulled on 10/20/2023.
5 DATA SOURCE: PREQIN Average holding period data is from Preqin’s Buyout Deals Analyst for all buyout deals in the Preqin database. Data accessed on 11/14/2023
Important Disclosures
For illustrative and discussion purposes only. No assurance can be given that any investment will achieve its objectives or avoid losses. The information and opinions expressed are as of the date set forth therein and may not be updated to reflect new information.
Investments in alternatives are speculative and involve substantial risk, including strategy risks, manager risks, market risks, and structural/ operational risks, and may result in the possible loss of your entire investment. The views expressed are for informational purposes only and are not intended to serve as a forecast, a guarantee of future results, investment recommendations, or an offer to buy or sell securities by GCM Grosvenor. All expressions of opinion are subject to change without notice in reaction to shifting market, economic, or political conditions. The investment strategies mentioned are not personalized to your financial circumstances or investment objectives, and differences in account size, the timing of transactions, and market conditions prevailing at the time of investment may lead to different results. Certain information included herein may have been provided by parties not affiliated with GCM Grosvenor. GCM Grosvenor has not independently verified such information and makes no representation or warranty as to its accuracy or completeness.
